Anthony Desimone
Data Analyst | SQL · Power BI · Excel · Python · R
I am a senior at the University of South Florida with a quantitative background in chemistry and economics, focused on applying data analysis to operational and business decision-making.
- LinkedIn: https://www.linkedin.com/in/anthonyfdesimone/
- GitHub: https://github.com/afdesimone This portfolio highlights analytics projects centered on evaluating business assumptions, interpreting results, and supporting data-driven decisions.
Featured Projects
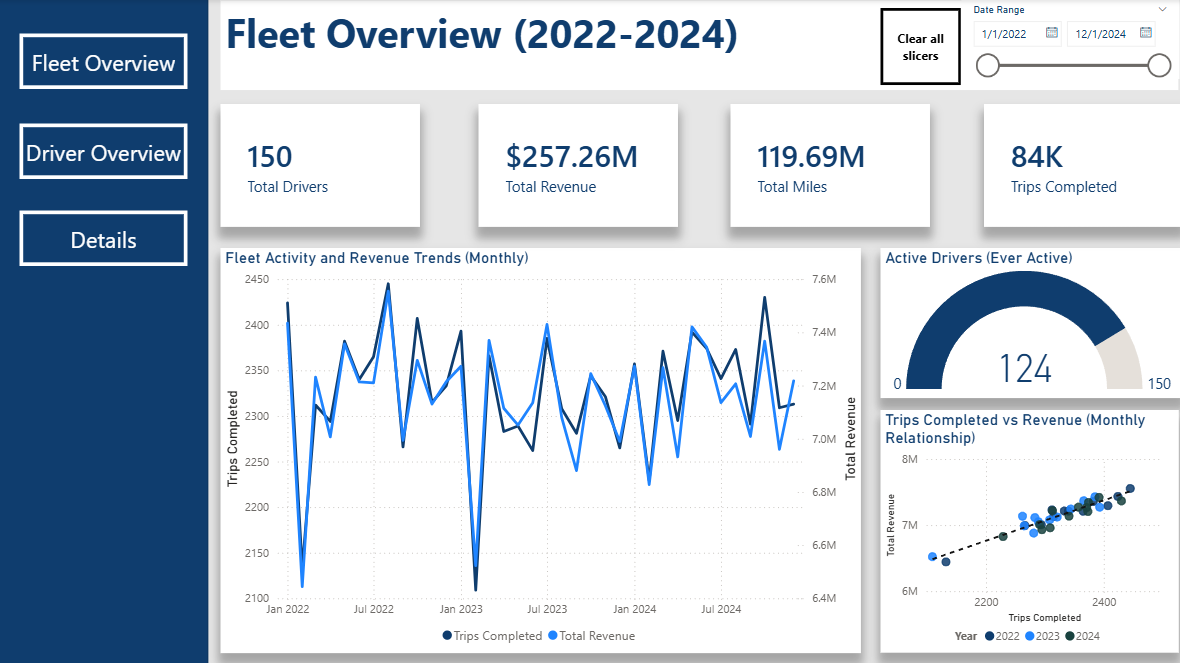
Logistics Operations Analytics — Driver Performance & Fleet Efficiency
Key Insight
Analysis showed minimal variation in driver-level KPIs and limited impact on revenue, indicating that individual driver performance is not a primary operational driving force. Results suggest that system-level factors such as routing, demand patterns, and load characteristics are more likely to drive revenue and efficiency.
Business Problem
Operations teams often assume that individual driver performance materially affects revenue and efficiency. This project evaluates whether driver-level KPIs meaningfully explain revenue outcomes or whether performance is driven by system-level factors.
Supporting Evidence
- Driver-level performance metrics showed minimal variation across individuals
- Individual driver KPIs exhibited limited explanatory power with respect to revenue
- Performance patterns were consistent across time periods and drivers
Business Implications - Individual driver performance is unlikely to be a high-impact management lever
- Analytical and operational focus should be directed toward system-level drivers rather than driver-level interventions
Analytical Approach & Deliverables - Designed a relational data model and created SQL views consumed by Power BI to ensure consistent KPI reporting, with CTEs used for exploratory and ad-hoc analysis
- Analyzed driver and fleet-level performance trends using SQL
- Developed interactive Power BI dashboards to support fleet-level monitoring and decision-making
View GitHub Repository: https://github.com/afdesimone/logistics-operations-analytics
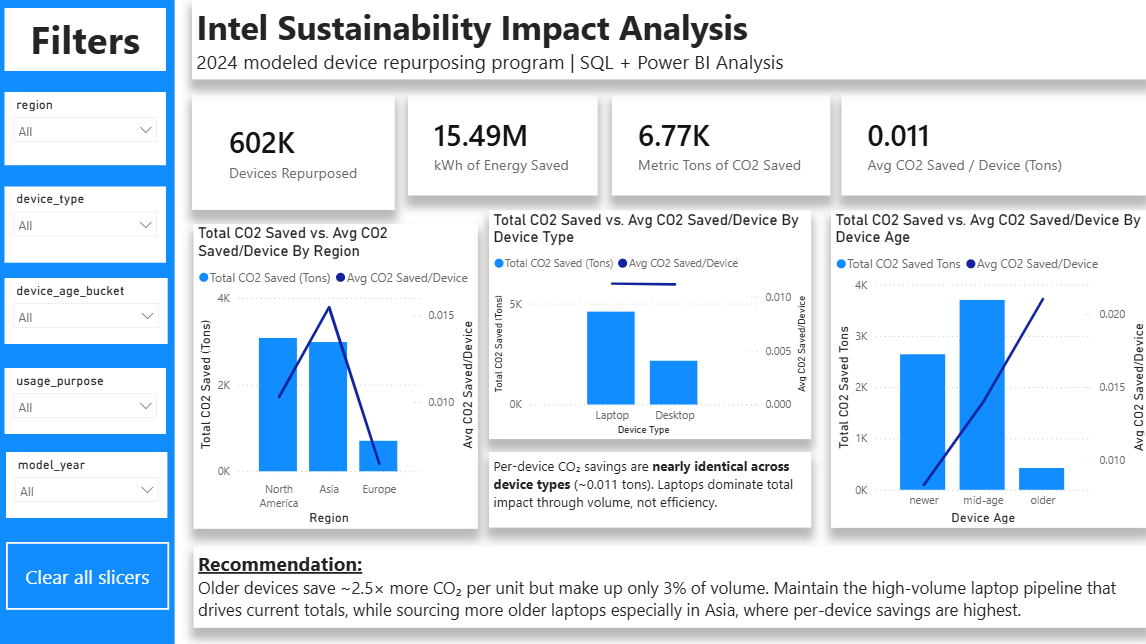
Intel Sustainability Analytics — Device Repurposing Program Impact
Key Insight
Total program impact is currently driven by laptop volume, but older devices produce roughly 2.5x the per-device energy savings of newer ones. Maintaining the high-volume laptop pipeline while gradually shifting sourcing toward older laptops in carbon-intensive regions is the higher-impact path forward.
Business Problem
Intel’s 2024 device repurposing program saved a meaningful amount of energy and CO₂, but program leadership needed to understand which device segments drove the most impact and where future sourcing should be prioritized to maximize per-device benefit.
Supporting Evidence
- 601,740 repurposed devices analyzed across two joined datasets
- Total program impact: 15.5 million kWh of energy saved and 6,768 metric tons of CO₂ saved annually
- Older devices averaged 48 kWh saved per device vs. 19 kWh for newer devices (~2.5x per-device benefit)
- Laptops accounted for ~68% of total energy and CO₂ savings, primarily because they made up the majority of repurposed devices
- North America produced the highest total CO₂ savings due to volume; Asia produced the highest per-device savings due to a more carbon-intensive grid
Business Implications - Total impact and per-device impact are different optimization targets, and program decisions should distinguish between them
- Future sourcing efforts should prioritize older laptops in carbon-intensive regions to lift per-device program impact without sacrificing scale
- Continuing to rely on volume alone leaves per-device benefit on the table
Analytical Approach & Deliverables - Built a PostgreSQL schema and ran a structured validation pass (row counts, duplicate checks, missing values, join integrity, range checks) before analysis
- Joined the device and impact datasets and created a reusable analysis view with derived device age and age-bucket fields using
CASE WHENlogic - Aggregated impact by device type, age bucket, region, and combined segments using grouped aggregations and CTEs for percentage calculations
- Modeled the SQL analysis view as a Power BI star schema (fact + four dimension tables) with DAX measures for total devices, energy savings, CO₂ savings, and per-device averages
- Designed an executive dashboard with KPI cards, slicers, and combo charts comparing total versus per-device impact for stakeholder communication
Power BI Data Model
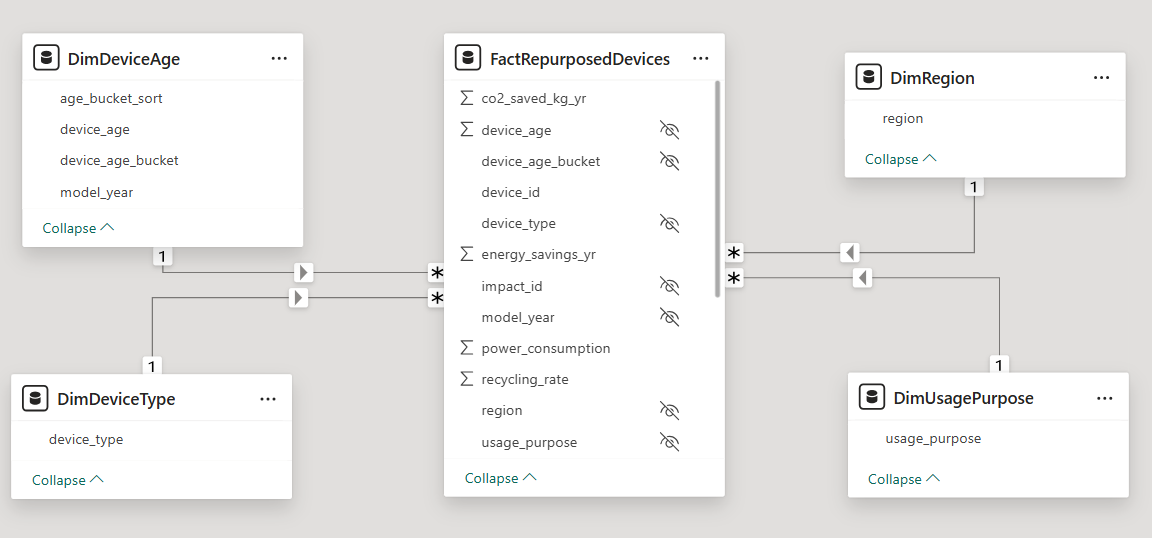
The SQL analysis view was loaded into Power BI and reorganized into a star schema with dimension tables for region, device type, usage purpose, and device age, supporting clean filtering, slicer-driven exploration, and reusable DAX measures.
View GitHub Repository: https://github.com/afdesimone/intel-sustainability-analytics
Technical Skills
- SQL (PostgreSQL, SQLite, joins, aggregations, CTEs, views, schema design,
CASE WHENlogic) - Power BI (data modeling, star schema design, DAX measures, interactive dashboards)
- Microsoft Excel (pivot tables, formulas, Power Query, LINEST regression)
- Python (pandas, numpy, matplotlib, plotly express)
- R (regression analysis, data visualization)